1 Introduction
Suppose you have been given the task of discovering groups, or clusters, that share certain characteristics within a dataset. There are various unsupervised machine learning algorithms that can be used to do this.
As we’ve seen in past posts, “k-Means Clustering” and “Affinity Propagation” can be used if you have good or easily separable data, respectively. Maybe this time the problem is that none of those two criteria are met. What to do?
The answer is: Mean Shift.
2 Loading the libraries
import numpy as np
import pandas as pd

import matplotlib.pyplot as plt
from sklearn.datasets import make_blobs

from sklearn.cluster import MeanShift, estimate_bandwidth
3 Generating some test data
For the following example, I will generate some sample data.
X, y = make_blobs(n_samples=1000, n_features = 3, centers = [(5,5), (3,3), (1,1)], cluster_std = 0.30)

plt.scatter(X[:, 0], X[:, 1])
plt.xlabel("Feature 1")
plt.ylabel("Feature 2")
plt.show()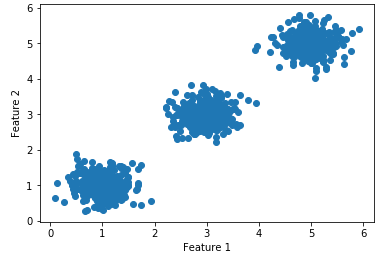
4 Introducing Mean Shift Clustering
In a nutshell: Mean Shift looks at the “mode” of the density, and where it is highest, and will iteratively shift points in the plot towards the closest mode – resulting in a number of clusters, and the ability to assign a sample to a cluster, after fitting is complete.
In this way, Mean Shift can still recognize clusters, even if they are not properly separated.
k-Means vs Mean Shift
Mean Shift looks very similar to k-Means, they both move the point closer to the cluster centroids. One may wonder: How is this different from k-Means? k-Means is faster in terms of runtime complexity!
The key difference is that Mean Shift does not require the user to specify the number of clusters (k). In some cases, it is not straightforward to guess the right number of clusters to use. In k-Means, the output may end up having too few clusters or too many clusters. This can lead to a skewed result. At the cost of larger time complexity, Mean Shift determines the number of clusters suitable to the dataset provided.
Another commonly cited difference is that k-Means can only learn circle or ellipsoidal clusters. The reason that Mean Shift can learn arbitrary shapes is because the features are mapped to another higher dimensional feature space through the kernel.
5 Mean Shift with scikit-learn
Let’s now take a look at how to implement Mean Shift with scikit-learn.
First of all we define bandwidth:
bandwidth = estimate_bandwidth(X, quantile=0.2, n_samples=500)and fit the algorithm to our data:
# Fit Mean Shift with Scikit
meanshift = MeanShift(bandwidth=bandwidth)
meanshift.fit(X)
labels = meanshift.labels_
labels_unique = np.unique(labels)
n_clusters_ = len(labels_unique)
print('Estimated number of clusters: ' + str(n_clusters_))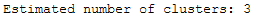
Now let’s do some predictions and have a look at the result
# Predict the cluster for all the samples
y_pred  = meanshift.predict(X)
plt.scatter(X[:, 0], X[:, 1], c=y_pred, cmap="viridis")
plt.xlabel("Feature 1")
plt.ylabel("Feature 2")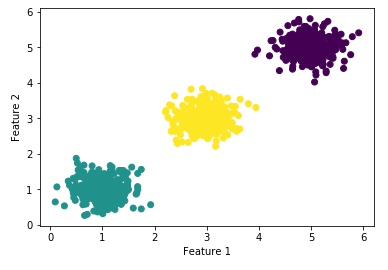
Looks good :)
6 Conclusion
In this post I showed that Mean Shift is a simple and versatile cluster algorithm that finds applications in general data clustering as well as in image processing and object tracking. It has similarities with k-Means but there are differences. Mean Shift is essentially iterations of weighted average of the datapoints.