1 Introduction
I entered the field of marketing analytics with the topic conversion rate analysis. Now we come to two other important areas:
- Prdouct Analytics and
- Recommendations
For this post the dataset Online Retail from the statistic platform “Kaggle” was used. You can download it from my “GitHub Repository”.
2 Import the libraries and the data
import pandas as pd
import numpy as np

import matplotlib.pyplot as plt
%matplotlib inline

from sklearn.metrics.pairwise import cosine_similarity
df = pd.read_excel('Online Retail.xlsx', sheet_name='Online Retail')
df.head()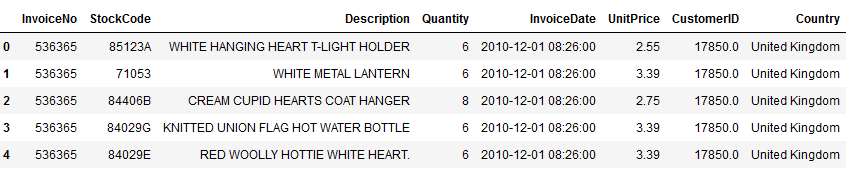
Let’s have a look at the oldest and earliest date.
print('Oldest Date: ' + str(df['InvoiceDate'].min()))
print('Earliest Date: ' + str(df['InvoiceDate'].max()))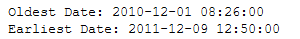
So we are going to analyse all dates between 2010/12/01 and 2011/11/30 to look at exactly one whole year.
df = df.loc[df['InvoiceDate'] < '2011-12-01']3 Product Analytics
With marketing analytics / product analytics it is always worthwhile to observe metrics over time.
3.1 Number of Orders over Time
df_monthly_orders = df.set_index('InvoiceDate')['InvoiceNo'].resample('M').nunique()ax = pd.DataFrame(df_monthly_orders.values).plot(
grid=True,
figsize=(10,7),
legend=False
)
ax.set_xlabel('date')
ax.set_ylabel('number of orders')
ax.set_title('Total Number of Orders Over Time')
ax.set_ylim([0, max(monthly_orders_df.values)+500])
plt.xticks(
range(len(monthly_orders_df.index)),
[x.strftime('%m.%Y') for x in monthly_orders_df.index],
rotation=45
)
plt.show()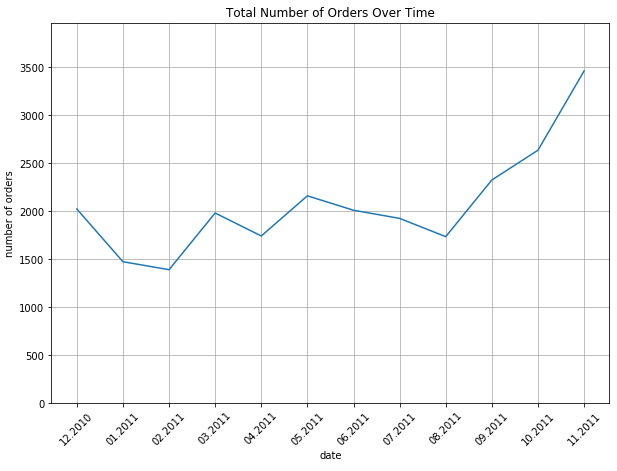
3.2 Revenue over Time
Let’s create a new sales-column for revenue.
df['Sales'] = df['Quantity'] * df['UnitPrice']df_monthly_revenue = df.set_index('InvoiceDate')['Sales'].resample('M').sum()ax = pd.DataFrame(df_monthly_revenue.values).plot(
grid=True,
figsize=(10,7),
legend=False
)
ax.set_xlabel('date')
ax.set_ylabel('sales')
ax.set_title('Total Revenue Over Time')
ax.set_ylim([0, max(monthly_revenue_df.values)+100000])
plt.xticks(
range(len(monthly_revenue_df.index)),
[x.strftime('%m.%Y') for x in monthly_revenue_df.index],
rotation=45
)
plt.show()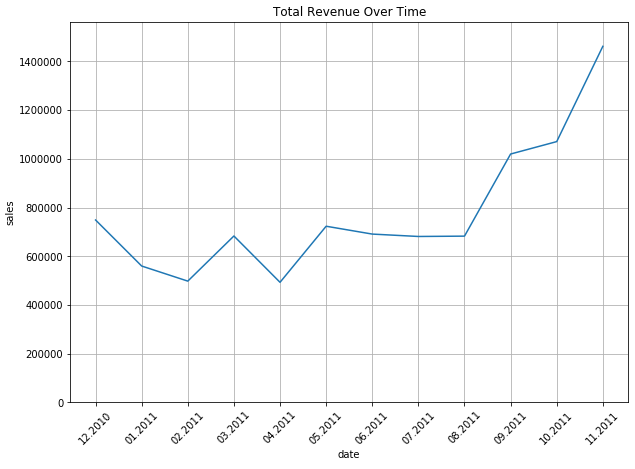
3.3 Repeat Customers over Time
df['InvoiceNo'].head()
Due to the fact that we have multiple records for one purchase order (InvoiceNo), we have to aggregate data for each order, so that one record in the dataset represents one purchase order.
df_invoice_customer = df.groupby(
    by=['InvoiceNo', 'InvoiceDate']
).agg({
    'Sales': sum,
    'CustomerID': max,
    'Country': max,
}).reset_index()


df_invoice_customer.head()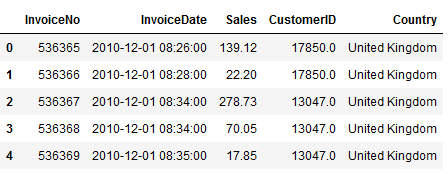
'''
Here we generate a record that shows the number of repeat customers by month.
Furthermore, we enrich the data set with a separate column for the month and the year.
'''


df_monthly_repeat_customers = df_invoice_customer.set_index('InvoiceDate').groupby([
    pd.Grouper(freq='M'), 'CustomerID'
]).filter(lambda x: len(x) > 1).resample('M').nunique()['CustomerID']

# Create dataframe from output
df_monthly_repeat_customers = pd.DataFrame(df_monthly_repeat_customers).reset_index()
df_monthly_repeat_customers = df_monthly_repeat_customers.rename(columns={'CustomerID':'repeat_customer_count'})

# Extract month (numeric and advertised) and year
df_monthly_repeat_customers['month'] = df_monthly_repeat_customers['InvoiceDate'].dt.month
df_monthly_repeat_customers['Month_Name'] = df_monthly_repeat_customers['month'].apply(lambda x: calendar.month_name[x])
df_monthly_repeat_customers['year'] = df_monthly_repeat_customers['InvoiceDate'].dt.year
df_monthly_repeat_customers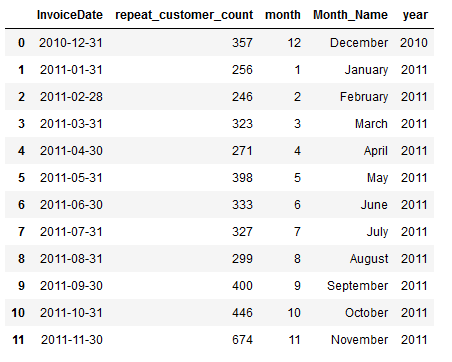
'''
Here we generate a data set that shows the number of unique customers by month.
Furthermore, we enrich the data set with a separate column for the month and the year.
'''

df_monthly_unique_customers = df_invoice_customer.set_index('InvoiceDate')['CustomerID'].resample('M').nunique()

# Create dataframe from output
df_monthly_unique_customers = pd.DataFrame(df_monthly_unique_customers).reset_index()
df_monthly_unique_customers = df_monthly_unique_customers.rename(columns={'CustomerID':'customer_count_unique'})

# Extract month (numeric and advertised) and year
df_monthly_unique_customers['month'] = df_monthly_unique_customers['InvoiceDate'].dt.month
df_monthly_unique_customers['Month_Name'] = df_monthly_unique_customers['month'].apply(lambda x: calendar.month_name[x])
df_monthly_unique_customers['year'] = df_monthly_unique_customers['InvoiceDate'].dt.year
df_monthly_unique_customers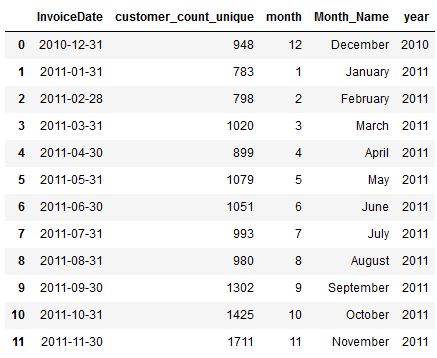
'''
Here we generate a data set that shows the percentage of repeat customers by month.
Furthermore, we enrich the data set with a separate column for the month and the year.
'''


# Calculate percentage of repeat customers
df_monthly_repeat_percentage = df_monthly_repeat_customers['repeat_customer_count']/df_monthly_unique_customers['customer_count_unique']*100.0

# Create dataframe from output
df_monthly_repeat_percentage = pd.DataFrame(df_monthly_repeat_percentage).reset_index().drop(["index"], axis = 1)

# Add according InvoiceDate from one of the previous created dataframes
df_monthly_repeat_percentage['InvoiceDate'] = df_monthly_unique_customers['InvoiceDate']


# Rearrange Columns
cols = list(df_monthly_repeat_percentage.columns)
cols = [cols[-1]] + cols[:-1]
df_monthly_repeat_percentage = df_monthly_repeat_percentage[cols]

# Rename Columns
df_monthly_repeat_percentage.columns = ['InvoiceDate','Repeat_Percentage']


# Extract month (numeric and advertised) and year
df_monthly_repeat_percentage['month'] = df_monthly_repeat_percentage['InvoiceDate'].dt.month
df_monthly_repeat_percentage['Month_Name'] = df_monthly_repeat_percentage['month'].apply(lambda x: calendar.month_name[x])
df_monthly_repeat_percentage['year'] = df_monthly_repeat_percentage['InvoiceDate'].dt.year

df_monthly_repeat_percentage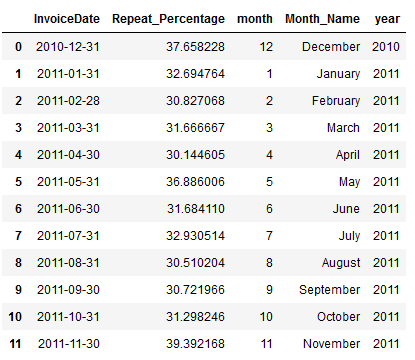
ax = pd.DataFrame(df_monthly_repeat_customers['repeat_customer_count'].values).plot(
    figsize=(10,7)
)

pd.DataFrame(df_monthly_unique_customers['customer_count_unique'].values).plot(
    ax=ax,
    grid=True
)


ax2 = pd.DataFrame(df_monthly_repeat_percentage['Repeat_Percentage'].values).plot.bar(
    ax=ax,
    grid=True,
    secondary_y=True,
    color='green',
    alpha=0.2
)

ax.set_xlabel('date')
ax.set_ylabel('number of customers')
ax.set_title('Number of All vs. Repeat Customers Over Time')

ax2.set_ylabel('percentage (%)')

ax.legend(['Repeat Customers', 'All Customers'])
ax2.legend(['Percentage of Repeat'], loc='upper right')

ax.set_ylim([0, df_monthly_unique_customers['customer_count_unique'].values.max()+100])
ax2.set_ylim([0, 100])

plt.xticks(
    range(len(df_monthly_repeat_percentage['InvoiceDate'])),
    [x.strftime('%m.%Y') for x in df_monthly_repeat_percentage['InvoiceDate']],
    rotation=45
)

plt.show()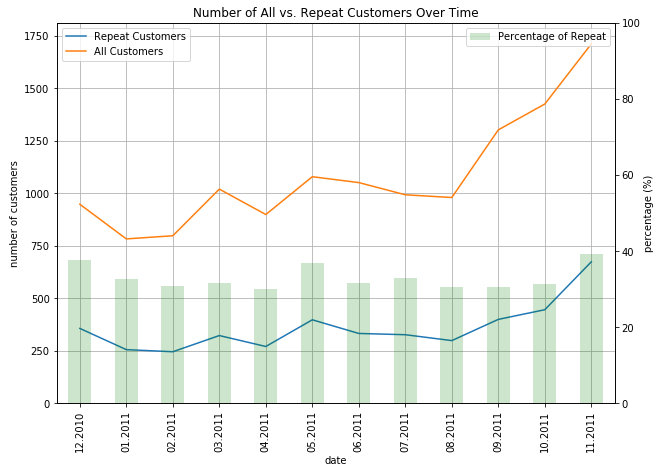
3.4 Repeat Customers Revenue over Time
'''
Here we generate a record that shows the revenue of repeat customers by month.
Furthermore, we enrich the data set with a separate column for the month and the year.
'''


df_monthly_rev_repeat_customers = df_invoice_customer.set_index('InvoiceDate').groupby([
    pd.Grouper(freq='M'), 'CustomerID'
]).filter(lambda x: len(x) > 1).resample('M').sum()['Sales']

# Create dataframe from output
df_monthly_rev_repeat_customers = pd.DataFrame(df_monthly_rev_repeat_customers).reset_index()
df_monthly_rev_repeat_customers = df_monthly_rev_repeat_customers.rename(columns={'CustomerID':'repeat_customer_revenue'})

# Extract month (numeric and advertised) and year
df_monthly_rev_repeat_customers['month'] = df_monthly_rev_repeat_customers['InvoiceDate'].dt.month
df_monthly_rev_repeat_customers['Month_Name'] = df_monthly_rev_repeat_customers['month'].apply(lambda x: calendar.month_name[x])
df_monthly_rev_repeat_customers['year'] = df_monthly_rev_repeat_customers['InvoiceDate'].dt.year
df_monthly_rev_repeat_customers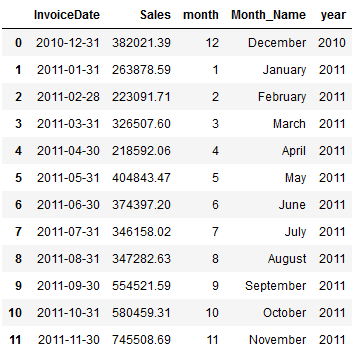
df_monthly_rev_perc_repeat_customers = df_monthly_rev_repeat_customers['Sales']/monthly_revenue_df.values * 100.0
df_monthly_rev_perc_repeat_customers


# Create dataframe from output
df_monthly_rev_perc_repeat_customers = pd.DataFrame(df_monthly_rev_perc_repeat_customers).reset_index().drop(["index"], axis = 1)

# Add according InvoiceDate from one of the previous created dataframes
df_monthly_rev_perc_repeat_customers['InvoiceDate'] = df_monthly_rev_repeat_customers['InvoiceDate']


# Rearrange Columns
cols = list(df_monthly_rev_perc_repeat_customers.columns)
cols = [cols[-1]] + cols[:-1]
df_monthly_rev_perc_repeat_customers = df_monthly_rev_perc_repeat_customers[cols]

# Rename Columns
df_monthly_rev_perc_repeat_customers.columns = ['InvoiceDate','Repeat_Cust_Rev_Percentage']

df_monthly_rev_perc_repeat_customers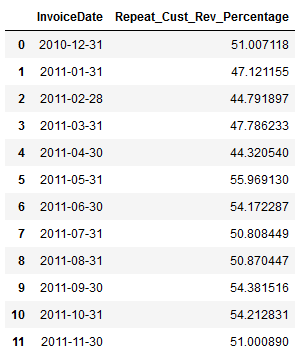
ax = pd.DataFrame(df_monthly_revenue.values).plot(
    figsize=(12,9))


pd.DataFrame(df_monthly_rev_repeat_customers['Sales'].values).plot(
    ax=ax,
    grid=True,
)

ax.set_xlabel('date')
ax.set_ylabel('sales')
ax.set_title('Total Revenue vs. Revenue from Repeat Customers')

ax.legend(['Total Revenue', 'Repeat Customer Revenue'])

ax.set_ylim([0, max(df_monthly_revenue.values)+100000])

ax2 = ax.twinx()

pd.DataFrame(df_monthly_rev_perc_repeat_customers['Repeat_Cust_Rev_Percentage'].values).plot(
    ax=ax2,
    kind='bar',
    color='g',
    alpha=0.2
)


ax2.set_ylim([0, max(df_monthly_rev_perc_repeat_customers['Repeat_Cust_Rev_Percentage'].values)+30])
ax2.set_ylabel('percentage (%)')
ax2.legend(['Repeat Revenue Percentage'])

ax2.set_xticklabels([
    x.strftime('%m.%Y') for x in df_monthly_rev_perc_repeat_customers['InvoiceDate']
])

plt.show()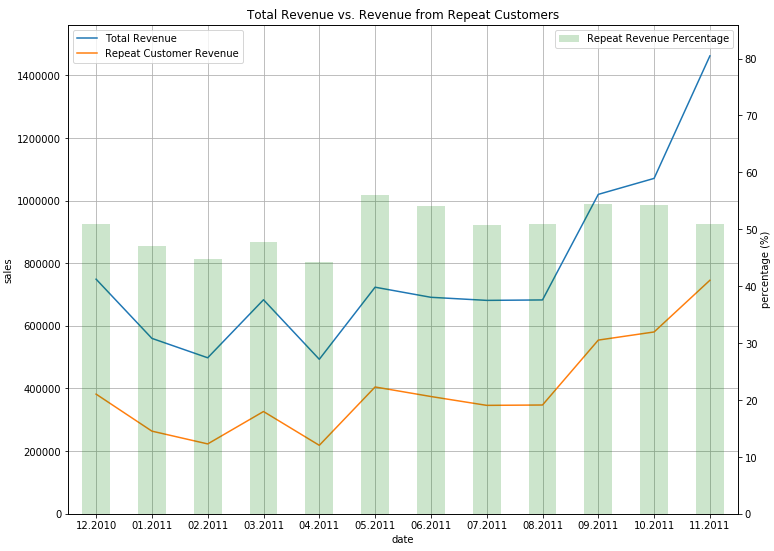
3.5 Popular Items over Time
'''
Here we create a dataset that is filtered to month = november and year = 2011.
'''


df_pop_items = df

df_pop_items['month'] = df_pop_items['InvoiceDate'].dt.month
df_pop_items['Month_Name'] = df_pop_items['month'].apply(lambda x: calendar.month_name[x])
df_pop_items['year'] = df_pop_items['InvoiceDate'].dt.year

df_pop_items = df_pop_items[(df_pop_items["month"] == 11) & (df_pop_items["year"] == 2011)]

df_pop_items.head()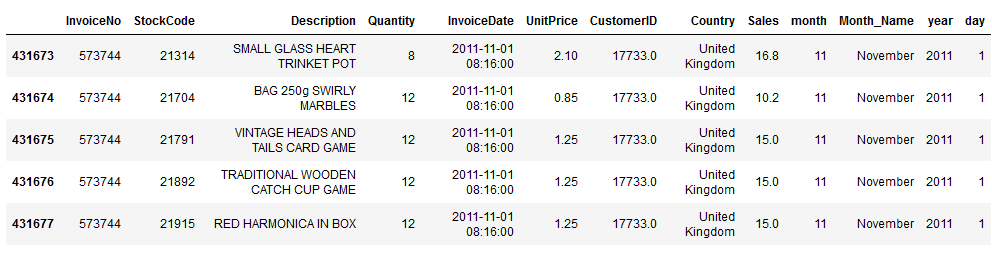
# Rank items
df_last_month_sorted = df_last_month_sorted[['InvoiceDate', 'StockCode', 'Quantity']]
df_last_month_sorted = df_last_month_sorted.sort_values(by='Quantity', ascending=False).reset_index()
df_last_month_sorted = df_last_month_sorted.drop(["index"], axis = 1)
df_last_month_sorted.head()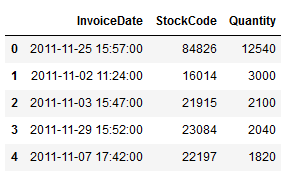
# Regroup for top 5 items
df_date_item = pd.DataFrame(
    df.loc[
        df['StockCode'].isin([84826, 16014, 21915, 23084, 22197])
    ].set_index('InvoiceDate').groupby([
        pd.Grouper(freq='M'), 'StockCode'
    ])['Quantity'].sum()
)
df_date_item.head()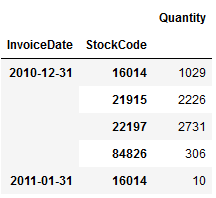
df_trending_itmes = df_date_item.reset_index().pivot('InvoiceDate','StockCode').fillna(0)

df_trending_itmes = df_trending_itmes.reset_index()
df_trending_itmes = df_trending_itmes.set_index('InvoiceDate')
df_trending_itmes.columns = df_trending_itmes.columns.droplevel(0)

df_trending_itmes
ax = pd.DataFrame(df_trending_itmes.values).plot(
    figsize=(10,7),
    grid=True,
)

ax.set_ylabel('number of purchases')
ax.set_xlabel('date')
ax.set_title('Item Trends over Time')

ax.legend(df_trending_itmes.columns, loc='upper left')

plt.xticks(
    range(len(df_trending_itmes.index)),
    [x.strftime('%m.%Y') for x in df_trending_itmes.index],
    rotation=45
)

plt.show()
It looks like the 5 identified top products from november 2011 are all christmas products, as they are not bought very much during the year, but only at the end of the year around christmas time.
4 Product Recommendations
For the product recommendations section, we again use the ‘Online Retail’ record. When loading the dataset, we filter all rows in column ‘Quantity’ that are greater than 0. This means that we now have a data record that contains at least one purchased product per line. Since the column ‘CustomerID’ contains missing values, these are excluded from further analysis.
df = pd.read_excel('Online Retail.xlsx', sheet_name='Online Retail')
df = df.loc[df['Quantity'] > 0]
df = df.dropna(subset=['CustomerID'])
df.head()
customer_item_matrix = df.pivot_table(
    index='CustomerID',
    columns='StockCode',
    values='Quantity',
    aggfunc='sum'
)

print('Shape of matrix: ' + str(customer_item_matrix.shape))

customer_item_matrix
Now we are going to encode this data 0-1. Hereby the value 1 means that the given product was purchased by the given customer and the value of 0 means that the given product was never purchased by the given customer.
customer_item_matrix = customer_item_matrix.applymap(lambda x: 1 if x > 0 else 0)
customer_item_matrix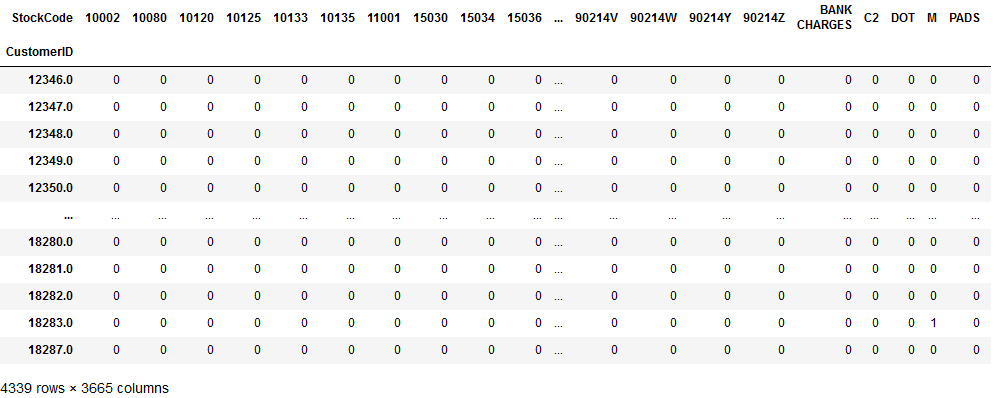
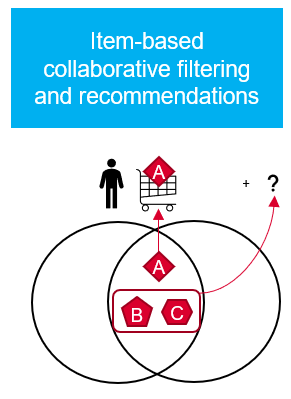
4.1 Collaborative Filtering
Collaborative filtering leverages the power of community to provide recommendations. Collaborative filters are one of the most popular recommender models used in the industry and have found huge success for companies.
One of the biggest prerequisites of a collaborative filtering system is the availability of data of past activity. Therefore, collaborative filters suffer from what we call the cold start problem if this data is not yet available.
Here we are going to explore two approches to building a product recommender:
- user-based
- item-based
In the first approach (user-based) we compute similarities between users based on their item purchase history. In the second approach (item-based) we compute similarities between items based in which items are often bought together with which other items.
The intentions behind it are the following:
In the first variant (user-based) it is checked whether customers buy many items together except for a few. It is possible that the items in which they differ are also interesting for the other customer.

In the second variant (item-based), the system looks to see which items customers like to buy together. If a customer buys products that have the same metrics, a similar product can be recommended to him.
4.1.1 User-based Collaborative Filtering
'''
User-to-User Similarity Matrix
Tip at this point: Go and have a coffee in the meantime, because the execution of this command takes some time.
'''

user_user_sim_matrix = pd.DataFrame(cosine_similarity(customer_item_matrix))
user_user_sim_matrix.columns = customer_item_matrix.index
user_user_sim_matrix['CustomerID'] = customer_item_matrix.index
user_user_sim_matrix = user_user_sim_matrix.set_index('CustomerID')
user_user_sim_matrix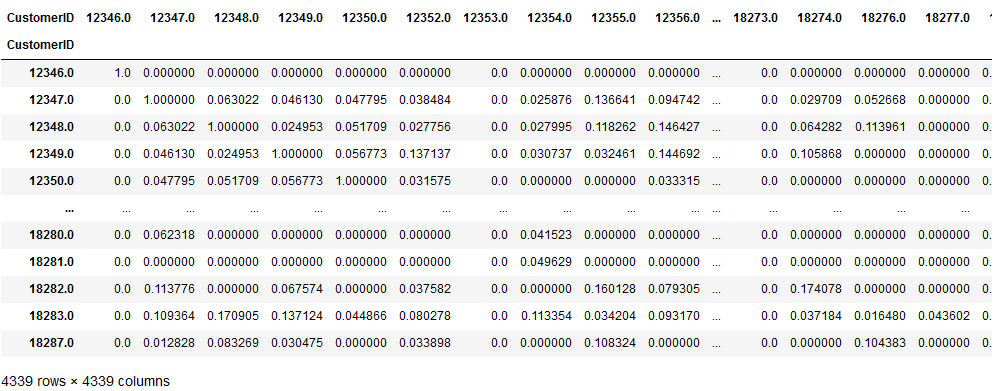
As we can see customer 12348 has the greatest similarity to customer 12347 than customer 12349.
Let’s pick customer 12347 to see the further proceeding. As first step we are going to rank the most similar customers to this customer (12347). Hereby we use the pairwise cosin similarity.
user_user_sim_matrix.loc[12347.0].sort_values(ascending=False)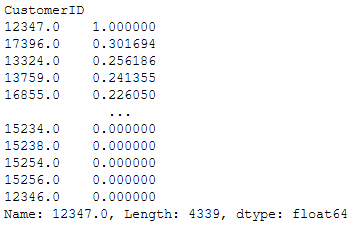
As we can see, customer 17396 (our current target customer) is most similar to customer 12347.
Now we are going to identify the items that the customer 12347 and 17396 have already bought. Then, we are going to find the products that the target customer 17396 has not purchased, but customer 12347 has. We hope that the target customer can also use these products and will buy them if we recommend them to him.
'''
Here we are going to look for which items customer 12347 has purchased in the past
'''

items_bought_by_12347 = set(customer_item_matrix.loc[12347.0].iloc[
    customer_item_matrix.loc[12347.0].to_numpy().nonzero()].index)
'''
Here we are going to look for which items target customer 17396 has purchased in the past
'''
items_bought_by_17396 = set(customer_item_matrix.loc[17396.0].iloc[
customer_item_matrix.loc[17396.0].to_numpy().nonzero()].index)items_to_recommend_to_17396 = items_bought_by_12347 - items_bought_by_17396
print('Number of items that can be recommended to the target customer: ' + str(len(items_to_recommend_to_17396)))
Since we can’t do very much with numbers alone, we will now request the descriptions for the respective items.
'''
Get descriptions of items to recommend
'''

df_items_to_recommend_to_17396 = df.loc[df['StockCode'].isin(items_to_recommend_to_17396),
    ['StockCode', 'Description']].drop_duplicates().set_index('StockCode').reset_index()

df_items_to_recommend_to_17396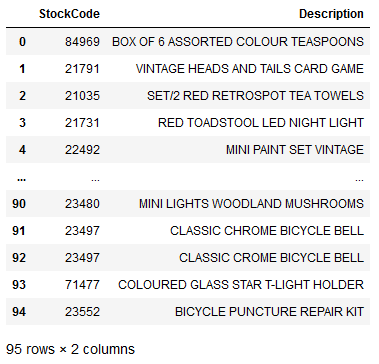
Okay, wait a minute. Why does my data frame have 95 lines when my article list has a length of 88? This is because two similar articles have partly the same stock code. See here:
df_items_to_recommend_to_17396[df_items_to_recommend_to_17396['StockCode'] == 23271]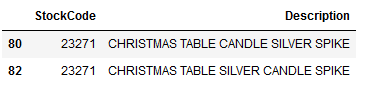
4.1.2 Item-based Collaborative Filtering
'''
Item-to-Item Similarity Matrix
'''

item_item_sim_matrix = pd.DataFrame(cosine_similarity(customer_item_matrix.T))
item_item_sim_matrix.columns = customer_item_matrix.T.index
item_item_sim_matrix['StockCode'] = customer_item_matrix.T.index
item_item_sim_matrix = item_item_sim_matrix.set_index('StockCode')
item_item_sim_matrix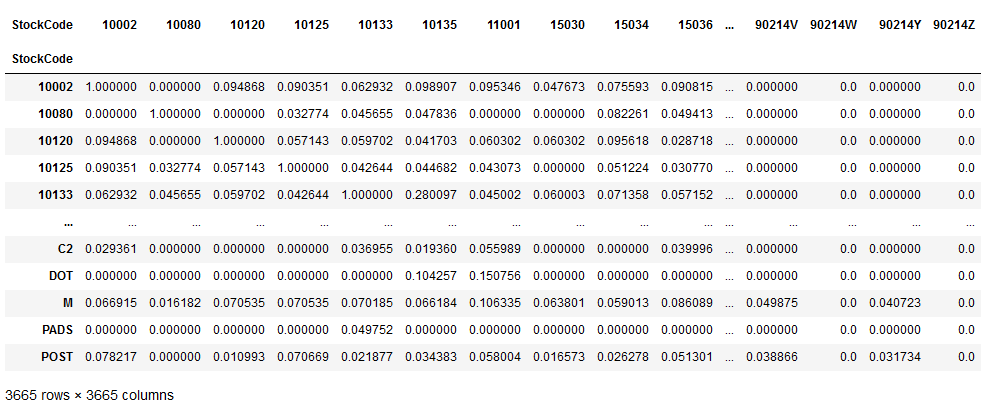
The interpretation of the matrix which item is more similar to another item etc. follows the same principle as I explained with the user_user_sim_matrix.
The following procedure is also very similar.
First we select a product (let’s say StockCode=23166) that a customer has just bought as an example. Then we will identify the most similar products to this product just purchased. With the knowledge we have gained, we can then approach the customer and suggest similar products to the product he has just purchased.
top_10_similar_items_for_23166 = list(
    item_item_sim_matrix\
        .loc[23166]\
        .sort_values(ascending=False)\
        .iloc[:10]\
    .index
)

top_10_similar_items_for_23166
Now we going to request the descriptions for the respective items again.
df_items_similar_to_23166 = df.loc[df['StockCode'].isin(top_10_similar_items_for_23166),
    ['StockCode', 'Description']].drop_duplicates().set_index('StockCode').loc[top_10_similar_items_for_23166]

df_items_similar_to_23166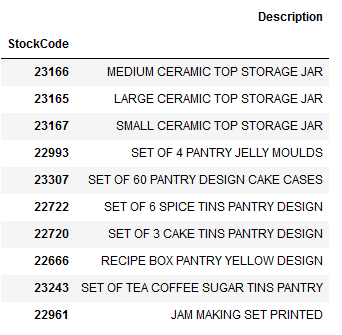
In the first line we see the article that was just bought. Afterwards 9 more items are shown, which have a high similarity to the purchased item.
In this case the client has bought MEDIUM CERAMIC TOP STORAGE JAR. Maybe he is also interested in buying the large variant (line 2)?
5 Conclusion
In this post I dealt with the analysis of products. Furthermore I showed how to develop and apply product recommendations with collaborative filtering (user-based and item-based).
References
The content of the entire post was created using the following sources:
Hwang, Y. (2019). Hands-On Data Science for Marketing: Improve your marketing strategies with machine learning using Python and R. Packt Publishing Ltd.