1 Introduction
Grid Search is the process of performing hyperparameter tuning in order to determine the optimal values for a given model. This is significant as the performance of the entire machine learning model is based on the hyper parameter values specified.

For this post the dataset Breast Cancer Wisconsin (Diagnostic) from the statistic platform “Kaggle” was used. You can download it from my GitHub Repository.
2 Background information on Grid Searach
Grid Search for hyperparameter optimization
A model hyperparameter is a characteristic of a model that is external to the model and whose value cannot be estimated from data. The value of the hyperparameter has to be set before the learning process begins. For example, c in Support Vector Machines, k in k-Nearest Neighbors, the number of hidden layers in Neural Networks.
In contrast, a parameter is an internal characteristic of the model and its value can be estimated from data. Example, beta coefficients of linear/logistic regression or support vectors in Support Vector Machines.
In a nutshell Grid Search is used to find the optimal hyperparameters of a model which results in the most ‘accurate’ predictions.
Why should I use it?
If you work with machine learning, you know what a nightmare it is to stipulate values for hyper parameters. There are methods, such as GridSearchCV of the scikit-learn bibliothek that have been implemented, in order to automate this process and make life a little bit easier for machine learning users.
3 Loading the libraries and the data
import numpy as np
import pandas as pd

# For chapter 4
from sklearn.model_selection import train_test_split

# For chapter 5
from sklearn.linear_model import LogisticRegression
from sklearn.metrics import accuracy_score

# For chapter 6
from sklearn.model_selection import GridSearchCV

# For chapter 6.3
from sklearn.pipeline import Pipeline
from sklearn.linear_model import LogisticRegression
from sklearn.svm import SVC
from sklearn.tree import DecisionTreeClassifier

# For chapter 8
from sklearn.model_selection import ParameterGrid
from sklearn.metrics import accuracy_score
cancer = pd.read_csv("path/to/file/breast_cancer.csv")
cancer.head()
The data set used contains 31 columns which contain information about tumors in the tissue. The column ‘diagnosis’ describes whether these tumors are benign (B) or malignant (M). Let’s try to create a classification model.
4 Data pre-processing
The target variable is then converted into numerical values.
vals_to_replace = {'B':'0', 'M':'1'}
cancer['diagnosis'] = cancer['diagnosis'].map(vals_to_replace)
cancer['diagnosis'] = cancer.diagnosis.astype('int64')
cancer.head()
x = cancer.drop(['id', 'diagnosis', 'Unnamed: 32'], axis=1)
y = cancer['diagnosis']

trainX, testX, trainY, testY = train_test_split(x, y, test_size = 0.2)
5 LogReg
With Grid Search we can optimize hyper parameters of all possible algorithms. Here we use “logistic regression” based on the previous “post”.
First we implement a simple log reg model and then we look at whether the accuracy can be improved with the optimized hyperparameters
logreg = LogisticRegression()
logreg.fit(trainX, trainY)

y_pred = logreg.predict(testX)

print('Accuracy: {:.2f}'.format(accuracy_score(testY, y_pred)))
6 Grid Search
Now let’s use Grid Search with the logistic regression model. I mostly use accuracy as scoring. However, other values such as recall or precision can also be very important. It is therefore worth reading a little deeper into this topic.
Recall and Precision are useful metrics when working with unbalanced datasets (i.e., there are a lot of samples with label ‘0’, but much fewer samples with label ‘1’. Recall and Precision also lead into slightly more complicated scoring metrics like F1_score (and Fbeta_score), which are also very useful.
6.1 Grid Search with LogReg
grid_values = {'penalty': ['l1', 'l2'],'C':[0.001, 0.10, 0.1, 10, 25, 50, 100, 1000]}

clf = LogisticRegression()

grid = GridSearchCV(clf, grid_values, cv = 10, scoring='accuracy')

grid.fit(trainX, trainY)

print(grid.best_params_) 
Here we see best parameters.
grid_predictions = grid.predict(testX)

print('Accuracy: {:.2f}'.format(accuracy_score(testY, grid_predictions)))
Unfortunately, we have not further improved the accuracy in this case.
6.2 Grid Search with other machine learning algorithms
As already mentioned, grid search can be used with all possible machine learning algorithms. Below is a list of the well-known algorithms I used this method:
Classifiacation:
- “Support Vector Machines”
- “SGD Classifier”
- “OvO and OvR Classifier”
- “Decision Trees”
- “KNN Classifier”
Regression:
6.3 Grid Search with more than one estimator
We can also use Grid Search with multiple estimator:
# Just initialize the pipeline with any estimator you like
pipe = Pipeline(steps=[('estimator', LogisticRegression())])

# Add a dict of estimator and estimator related parameters in this list
params_grid = [{
                'estimator':[LogisticRegression()],
                'estimator__penalty': ['l1', 'l2'],
                'estimator__C': [0.001, 0.10, 0.1, 10, 25, 50, 100, 1000]
                },
                {
                'estimator':[SVC()],
                'estimator__C': [0.1, 1, 10, 100, 1000],
                'estimator__gamma': [1, 0.1, 0.01, 0.001, 0.0001],
                'estimator__kernel': ['linear'],
                },
                {
                'estimator': [DecisionTreeClassifier()],
                'estimator__criterion': ["gini", "entropy"],
                'estimator__min_samples_split': [2, 5, 10, 15, 20],
                'estimator__max_depth': [None, 2, 3, 5, 7, 10],
                'estimator__min_samples_leaf': [1, 3, 5, 7, 10],
                'estimator__max_leaf_nodes': [None, 3, 5, 7, 10, 15, 20],
                }
              ]

grid = GridSearchCV(pipe, params_grid, cv=5, scoring='accuracy')

grid.fit(trainX, trainY)

print(grid.best_params_) 
grid_predictions = grid.predict(testX)

print('Accuracy: {:.2f}'.format(accuracy_score(testY, grid_predictions)))
As we can see, the use of support vector machines gives the best results for this classification problem.
7 Speed up GridSearchCV using parallel processing
If you use the last grid search shown, you will find that the required computing power is very high and you may have to wait longer. For this case you can use parallel processing. Just set the parameter n_jobs to -1.
import time

start = time.time()

grid = GridSearchCV(pipe, params_grid, cv=5, scoring='accuracy')
grid.fit(trainX, trainY)

end = time.time()
print()
print('Calculation time: ' + str(round(end - start,2)) + ' seconds')
start = time.time()

grid = GridSearchCV(pipe, params_grid, cv=5, scoring='accuracy', n_jobs=-1)
grid.fit(trainX, trainY)

end = time.time()
print()
print('Calculation time: ' + str(round(end - start,2)) + ' seconds')
8 Parameter Grid
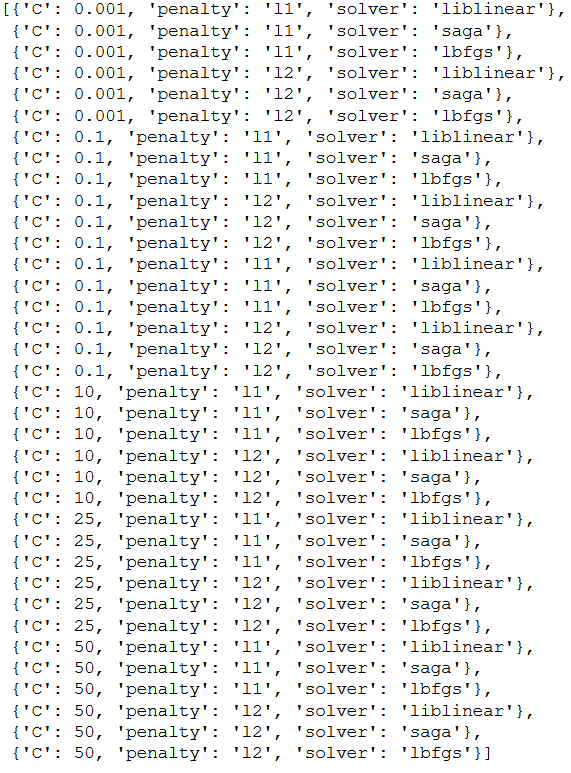
Another very useful feature is Parameter Grid. Here I have the possibility to output evaluation metrics for each individual parameter combination. For the following example, I again use the Logistic Regression algorithm and the associated parameters.
param_grid = {'penalty': ['l1', 'l2'],
              'C':[0.001, 0.10, 0.1, 10, 25, 50],
              'solver': ['liblinear', 'saga', 'lbfgs']}

pg = list(ParameterGrid(param_grid))

pg
df_results_LogReg = pd.DataFrame(columns=['penalty', 'C', 'solver', 'Accuracy'])

for a,b in enumerate(pg):
    penalty_setting = b.get('penalty')
    C_value = b.get('C')
    solver_setting = b.get('solver')

    fit_LogReg = LogisticRegression().fit(trainX, trainY)
    pred_gs_pred_LogReg = fit_LogReg.predict(testX)

    df_pred = pd.DataFrame(pred_gs_pred_LogReg, columns=['Prediction_result'])
    acc = accuracy_score(testY, df_pred.Prediction_result)

    df_results_LogReg = df_results_LogReg.append({'penalty':penalty_setting,
                                                  'C':C_value, 'solver': solver_setting,
                                                  'Accuracy':acc}, ignore_index=True)
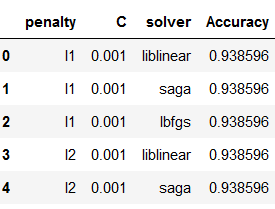
Let’s have a look at the results: I use .head() to print only the first 5 rows. Without .head() we would get the entire list of parameter combinations and the corresponding validation metrics.
df_results_LogReg.head()
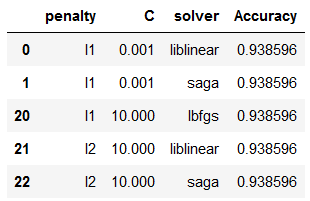
Normally we would get different accuracy values. To get the row with the highest accuracy I use .sort_values() and the addition ascending=False.
df_results_LogReg.sort_values(by=['Accuracy'], ascending=False).head()
Let’s pick the first row.
best_values_LogReg = df_results_LogReg.sort_values(by=['Accuracy'], ascending=False).head(1)
best_values_LogReg
And extract the best values:
penalty_setting_LogReg = best_values_LogReg['penalty'].iloc[0]
c_value_LogReg = best_values_LogReg['C'].iloc[0]
solver_setting_LogReg = best_values_LogReg['solver'].iloc[0]

print("penalty_setting_LogReg: ", penalty_setting_LogReg)
print("c_value_LogReg: ", c_value_LogReg)
print("solver_setting_LogReg: ", solver_setting_LogReg)
Now we can train our final model.
final_LogReg = LogisticRegression(penalty=penalty_setting_LogReg, C=c_value_LogReg, solver=solver_setting_LogReg)
final_LogReg.fit(trainX, trainY)

y_pred = final_LogReg.predict(testX)

print('Accuracy: {:.2f}'.format(accuracy_score(testY, y_pred)))