1 Introduction
In my previous “post” the question came up of how to check its data on normal distribution. There are several possibilities for this.
2 Loading the libraries
import pandas as pd
import numpy as np
import pylab
import scipy.stats as stats
import matplotlib.pyplot as plt

#For Chapter 4.1
from scipy.stats import shapiro
#For Chapter 4.2
from scipy.stats import normaltest
3 Visual Normality Checks
np.random.seed(1)

df = pd.DataFrame({
    'Col_1': np.random.normal(0, 2, 30000),
    'Col_2': np.random.normal(5, 3, 30000),
    'Col_3': np.random.normal(-5, 5, 30000)
})

df.head()
3.1 Quantile-Quantile Plot
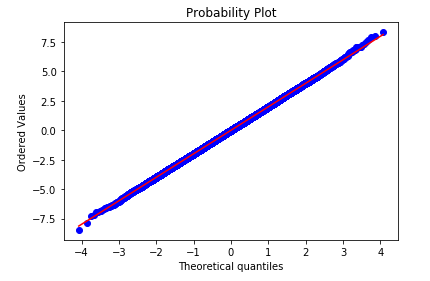
A popular plot for checking the distribution of a data sample is the quantile-quantile plot, Q-Q plot, or QQ plot for short.A perfect match for the distribution will be shown by a line of dots on a 45-degree angle from the bottom left of the plot to the top right. Often a line is drawn on the plot to help make this expectation clear. Deviations by the dots from the line shows a deviation from the expected distribution.
stats.probplot(df['Col_1'], dist="norm", plot=pylab)
pylab.show()
3.2 Histogram Plot
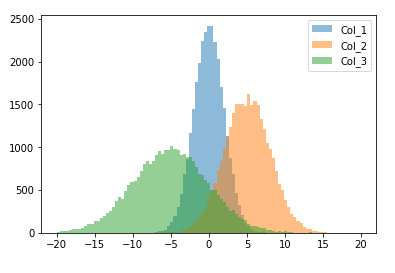
A simple and commonly used plot to quickly check the distribution of a sample of data is the histogram.
bins = np.linspace(-20, 20, 100)

plt.hist(df['Col_1'], bins, alpha=0.5, label='Col_1')
plt.hist(df['Col_2'], bins, alpha=0.5, label='Col_2')
plt.hist(df['Col_3'], bins, alpha=0.5, label='Col_3')
plt.legend(loc='upper right')
plt.show()
4 Statistical Normality Tests
A normal distribution can also be examined with statistical tests. Pyhton’s SciPy library contains two of the best known methods.
In the SciPy implementation of these tests, you can interpret the p value as follows.
- p <= alpha: reject H0, not normal
- p > alpha: fail to reject H0, normal
4.1 Shapiro-Wilk Test
The Shapiro-Wilk test evaluates a data sample and quantifies how likely it is that the data was drawn from a Gaussian distribution.
shapiro(df['Col_1'])
stat, p = shapiro(df['Col_1'])print('Statistics=%.3f, p=%.3f' % (stat, p))
alpha = 0.05
if p > alpha:
 print('Sample looks Gaussian (fail to reject H0)')
else:
 print('Sample does not look Gaussian (reject H0)')
4.2 D’Agostino’s K² Test
The D’Agostino’s K2 test calculates summary statistics from the data, namely kurtosis and skewness, to determine if the data distribution departs from the normal distribution,
normaltest(df['Col_1'])
stat, p = normaltest(df['Col_1'])print('Statistics=%.3f, p=%.3f' % (stat, p))
alpha = 0.05
if p > alpha:
 print('Sample looks Gaussian (fail to reject H0)')
else:
 print('Sample does not look Gaussian (reject H0)')