1 Introduction
Goupby is one of the most used functions in data analysis. Therefore, it is worth to take a closer look at their functioning.
For this post the dataset flight from the statistic platform “Kaggle” was used. You can download it from my GitHub Repository.
2 Loading the libraries and the data
import pandas as pd
import numpy as np
flight = pd.read_csv("path/to/file/flight.csv")3 Group by
flight.groupby('Origin_Airport').size().head()
flight.groupby(['Origin_Airport','DayOfWeek']).size().head(17).T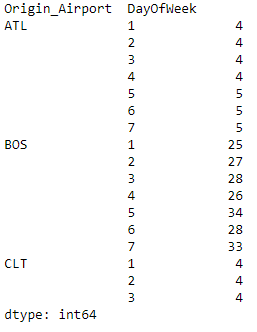
flight.groupby(['Origin_Airport']).get_group('BOS').head()
#add. Filter on 'BOS'
3.1 with size
df = pd.DataFrame({"Person":
                   ["John", "Myla", "Lewis", "John", "Myla"],
                   "Age": [24., np.nan, 21., 33, 26],
                   "Single": [False, True, True, True, False]})
df 
df[['Single', 'Age']].groupby(['Single']).size() 
3.2 with count
df[['Single', 'Age']].groupby(['Single']).count()
#The count function don't consicer NaN values
3.2.1 Count Non - Zero Observations
Vertical count
df = pd.DataFrame({"Person":
                   ["Männlich", "Weiblich", "Männlich", "Männlich", "Weiblich", "Männlich", "Weiblich",                     "Männlich", "Weiblich", "Männlich", "Weiblich", "Männlich", "Weiblich"],
                    "Verspätung in Min.": [0, 0, 4., 0, 5, 1, 0, 0, 11, 5, 4, 0, 9]})
df.head(6)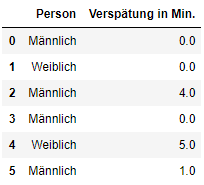
df['Verspätet?'] = np.where(df['Verspätung in Min.'] > 0, 1, 0)
df[['Person', 'Verspätet?']].groupby(['Person']).sum()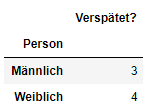
Horizontal count
df = pd.DataFrame({"Person":
                   ["Person 1", "Person 2", "Person 3"],
                   "MZP1":
                   [0, 2, 4],
                   "MZP2":
                   [0, 3, 6],
                   "MZP3":
                   [1, 7, 0]})
df.head() 
df2 = df[['MZP1', 'MZP2', 'MZP3']]
df2['Zwischensumme'] = df.astype(bool).sum(axis=1)
df2['Verspätungen'] = df2.Zwischensumme - 1
df2
astype(bool).sum(axis=1) also counts the index (and categorical variables if any). Therefore select and “Zwischensmme - 1”
df['Anzahl Verspätungen'] = df2.Verspätungen
df = df[['Person', 'Anzahl Verspätungen']].sort_values(by='Anzahl Verspätungen', ascending=False)
df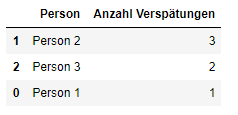
3.3 with sum
df[['Single', 'Age']].groupby(['Single']).sum().reset_index() 
3.4 with nunique
df.groupby(['Single']).nunique()
#nunique counts characteristics within the respective sorting (without NAs)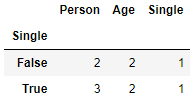
3.5 with mean
df[['Single', 'Age']].groupby(['Single']).mean().reset_index() 
3.6 with agg.
df[['Single', 'Age']].groupby(['Single']).agg(['mean', 'median', 'std', 'min', 'max']).reset_index()
df_rank = flight.groupby('Origin_Airport')      #another way

df_descriptive = df_rank['Dep_Delay'].agg(['mean', 'median', 'std', 'min', 'max']).reset_index()


# Renaming Pandas Dataframe Columns
df_descriptive = df_descriptive.rename(columns={'Origin_Airport':'Origin Airport', 'mean':'Mean', 'median':'Median', 'std':'Standard Deviation', 'min':'Minimum', 'max': 'Maximum'})

df_descriptive.head()
4 Convert the group_by output to a dataframe
Sometimes we want to further analyze the output of a group_by command. For this purpose it is suitable to transform the output into such a format.
For this I create an example data set again:
df = pd.DataFrame({"Person": ["John", "John", "John", "Myla", "Myla"],
                   "consumption": [40, 10, 40, 5, 15]})
df
With most group_by commands (mean, sum and count) the format dataframe is already stored. Only some columns are still pivoted. This can be adjusted as follows.
grouped_df = df.groupby('Person').mean()
grouped_df
reset_df = grouped_df.reset_index()
reset_df
For example if we use group_by with size we get the following output:
grouped_df_2 = df.groupby('Person').size()
grouped_df_2
But we can also solve this problem with reset_index(). Even better, we can even give the name the column should take.
reset_df_2 = grouped_df_2.reset_index(name='number_of_observations')
reset_df_2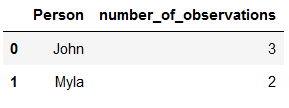
5 Conclusion
This was a small insight, how the groupby function works.