1 Introduction
Often Python is used to create reports. Since most managers like to have the analysis results and graphics presented in Power Points or similar, it is important to know how to extract tables and images accordingly.
2 Import the libraries
import pandas as pd
import numpy as np
import matplotlib.pyplot as plt
import seaborn as sns
3 Definition of required functions
def table_to_img_function(data, col_width=3.0, row_height=0.625, font_size=14,
                          header_color='#40466e', row_colors=['#f1f1f2', 'w'], edge_color='w',
                          bbox=[0, 0, 1, 1], header_columns=0, ax=None, **kwargs):
    '''
    Converts a table to an image

    Args:
        data (string): Name that should be given to the created image
        col_width (float64): Width of columns, float
        row_height (float64): Height of rows, float
        font_size (int): Size of the front, integer
        header_color (string): Color of the header, string
        row_colors (string): Color of the rows, string
        edge_color (string): Color of the edges, string
        bbox (int): Mutable bounding box, integers
        header_columns (int): Colored marking of column names or entire additional columns, integers

    Returns:
        Image of the supplied dataset
    '''
    if ax is None:
        size = (np.array(data.shape[::-1]) + np.array([0, 1])) * np.array([col_width, row_height])
        fig, ax = plt.subplots(figsize=size)
        ax.axis('off')
    mpl_table = ax.table(cellText=data.values, bbox=bbox, colLabels=data.columns, **kwargs)
    mpl_table.auto_set_font_size(False)
    mpl_table.set_fontsize(font_size)

    for k, cell in mpl_table._cells.items():
        cell.set_edgecolor(edge_color)
        if k[0] == 0 or k[1] < header_columns:
            cell.set_text_props(weight='bold', color='w')
            cell.set_facecolor(header_color)
        else:
            cell.set_facecolor(row_colors[k[0]%len(row_colors) ])
    return ax.get_figure(), ax
def createFolder(directory):
'''
Creates a folder in the place of the root directory
Args:
directory (string): Name that should be given to the created folder
Returns:
New folder at the current directory
'''
try:
if not os.path.exists(directory):
os.makedirs(directory)
except OSError:
print ('Error: Creating directory. ' + directory)4 Create a folder and a customized DataFrame
In order to be able to save the following images in a suitable place, we will first create a separate folder for them. We call this folder ‘images’.
createFolder('./images/')Now we create a corresponding data set.
df = pd.DataFrame({'Name': ['Maria', 'Marc', 'Julia'],
                   'Age': [24,22,26],
                   'Work_Experience': [7, 5, 8],
                   'Gender': ['female', 'male', 'female']})
df
5 Safe tables and images to disc
5.1 Safe tables to disc
Now we can use the function we created earlier (table_to_img_function) to save this record as an image.
fig,ax = table_to_img_function(df, col_width=3.0)
fig.savefig('images/Student_Table.png')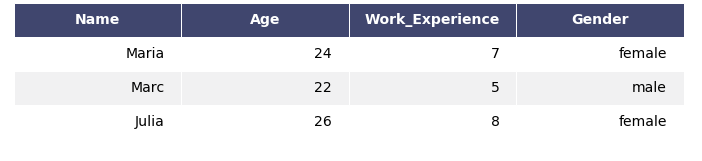
If you want to automate/customize the naming of how the image should be saved you can do so as follows:
year = 2021

fig.savefig('images/' + str(year) + '_' + 'Student_Table.png')
5.2 Safe images to disc
Let’s use a portion of the data set to generate a boxplot.
df_boxplot = df[['Age', 'Work_Experience']]
df_boxplot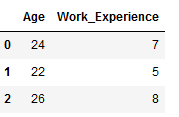
Now we generate the boxplot and save it immediately.
# Generate boxplot
sns.boxplot(x="variable", y="value", data=pd.melt(df_boxplot))
plt.title("Student Table",fontweight='bold')
plt.xlabel("Columns",fontweight='bold')
plt.ylabel("Years",fontweight='bold')

# Safe Image to disc
plt.savefig('images/Student_Table_Boxplot.png')

plt.show()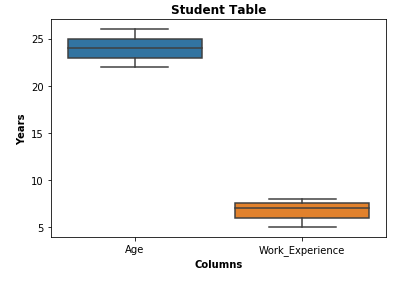
It is important to use the plt.savefig command first and then plt.show() otherwise you will get an image without content.
The final folder structure (and the included images we just created) looks like this:

6 Conclusion
In this short post, I showed how to convert tables to images and dump them. I did the same with generated graphics.