1 Introduction
Many people like to work with pivot tables in Excel. This possibility also exists in Python.
For this post the dataset WorldHappinessReport from the statistic platform “Kaggle” was used. You can download it from my GitHub Repository.
Loading the libraries and the data
import pandas as pd
import numpy as np
happy = pd.read_csv("path/to/file/WorldHappinessReport.csv")2 Getting an overview of our data
happy.head(2)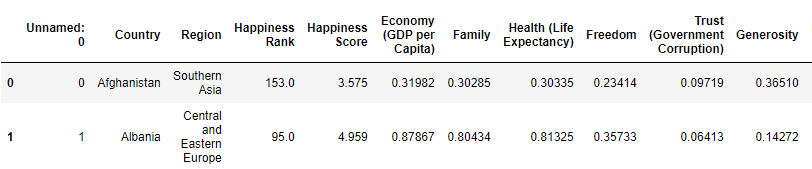
Getting an overview of our data and checking for missing values:
print("Our data has {0} rows and {1} columns".format(happy.shape[0], happy.shape[1]))
print("Are there missing values? {}".format(happy.isnull().any().any()))
3 Categorizing the data by Year and Region
pd.pivot_table(happy, index= 'Year', values= "Happiness Score")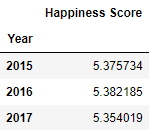
pd.pivot_table(happy, index = 'Region', values="Happiness Score").head()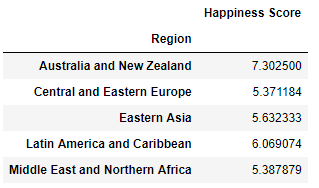
4 Creating a multi-index pivot table
pd.pivot_table(happy, index = ['Region', 'Year'], values="Happiness Score").head(9)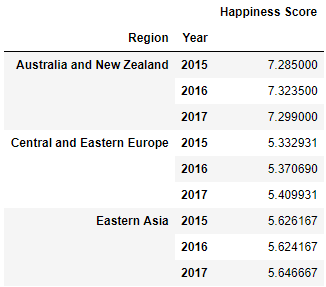
pd.pivot_table(happy, index= 'Region', columns='Year', values="Happiness Score")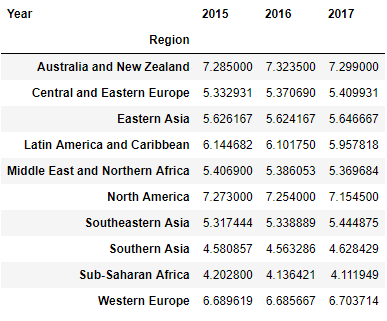
5 Manipulating the data using aggfunc
pd.pivot_table(happy, index= 'Region', values= "Happiness Score", aggfunc= [np.mean, np.median, np.min, np.max, np.std])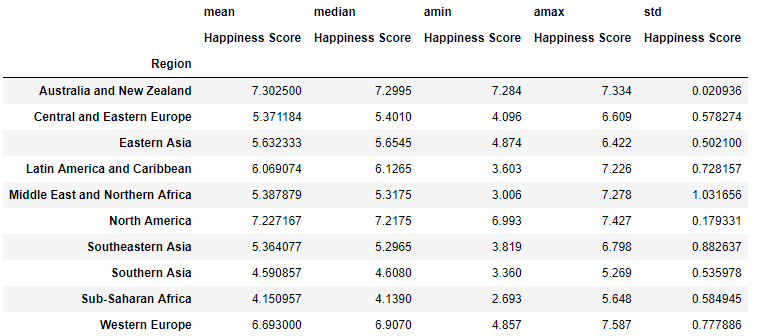
6 Applying a custom function to remove outlier
Here we see how many countries exist in a region
happy[['Region', 'Country']].groupby(['Region']).nunique().drop(columns=['Region']).reset_index()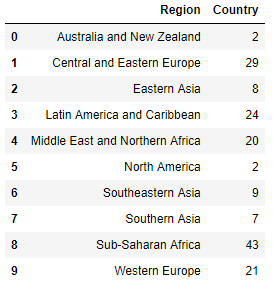
Let’s create a function that only calculates the values that are between the 0.25th and 0.75th quantiles.
def remove_outliers(values):
    mid_quantiles = values.quantile([.25, .75])
    return np.mean(mid_quantiles)


pd.pivot_table(happy, index = 'Region', values="Happiness Score", aggfunc= [np.mean, remove_outliers])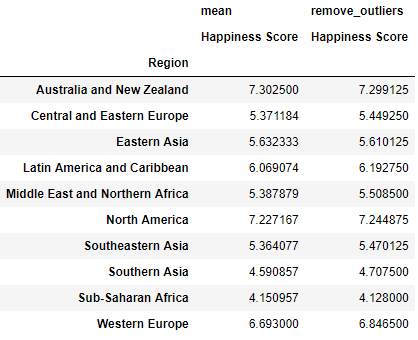
7 Categorizing using string manipulation
Here for Asia:
table = pd.pivot_table(happy, index = 'Region', values="Happiness Score", aggfunc= [np.mean, remove_outliers])
table[table.index.str.contains('Asia')]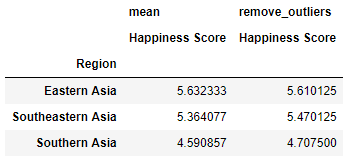
Here for Europe:
table[table.index.str.contains('Europe')]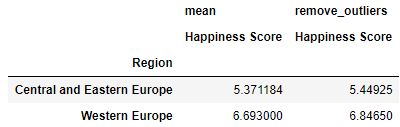
Now for certain years and regions:
table = pd.pivot_table(happy, index = ['Region', 'Year'], values='Happiness Score',aggfunc= [np.mean, remove_outliers])

table.query('Year == [2015, 2017] and Region == ["Sub-Saharan Africa", "Middle East and Northern Africa"]')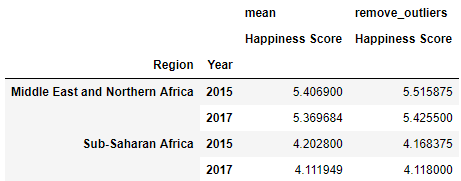
8 Conclusion
As you can see in Python you do not have to do without pivot tables if you like working with them. In my opinion, pivot tables are a great way to get a quick overview of the data and make comparisons between variables.