1 Introduction
After merging data (data management), we now come to the topic of how to reshape DataFrames.
2 Import the libraries
import pandas as pd
import matplotlib.pyplot as plt
import seaborn as sns
3 Import the data
df = pd.DataFrame({'Name': ['Alice', 'Mike', 'Sven', 'Julia'],
                   'Age': [25,35,22,24],
                   'Height': [160,175,180,165],
                   'Weight': [55,80,85,57],
                   'State': ['Texas', 'Boston', 'Marquette', 'Alaska']})
4 Reshape a pandas DataFrame
4.1 stack()
Stack method works with the MultiIndex objects in DataFrame, it returning a DataFrame with an index with a new inner-most level of row labels. It changes the wide table to a long table.
In short: The stack function of pandas is used for stacking the levels from columns to index.
print('Original DataFrame:')
df
df_stacked = df.stack()
df_stacked = pd.DataFrame(df_stacked)
df_stacked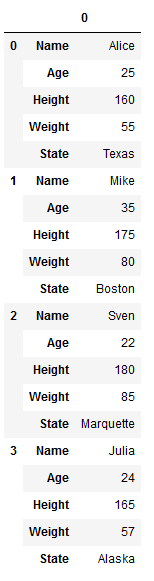
Of course, you can also undo this redesign.
df_unstacked = df_stacked.unstack()
df_unstacked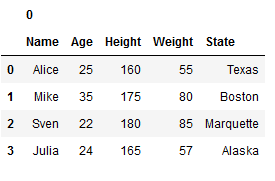
4.1.1 Application example
How can you use this function meaningfully in real life?
Information from rows
For some analysis methods it is necessary to have the values per line in one column available separately. Have a look at this dataframe:
df_appl_1 = pd.DataFrame({'title': ['A', 'B', 'C'],
                          'Runtime': [81,50,120],
                          'genres': ['animation, comedy, family', 'romance, comedy', 'comedy']})
df_appl_1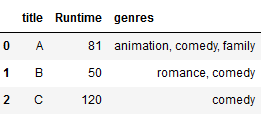
The different genres that apply to each film are unfortunately summarized in one column. Now we want the genres to be listed per line. For example, if a film is attributed three genres, I want the film to be listed in three separate lines, each with one of the three genres attributed. I can achieve this in 4 steps:
# Step 1
# We start with creating a new dataframe from the series with title as the index
new_df = pd.DataFrame(df_appl_1.genres.str.split(',').tolist(), index=df_appl_1.title).stack()
new_df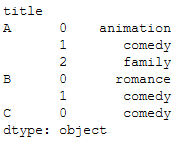
# Step 2
# We now want to get rid of the secondary index
# To do this, we will make title as a column (it can't be an index since the values will be duplicate)
new_df = new_df.reset_index([0, 'title'])
new_df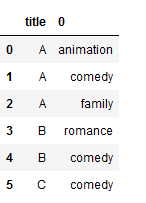
# Step 3
# Now we have to set the column names as we want them
new_df.columns = ['title', 'genre']
new_df
# Step 4
# The final step is to add the remaining information from the original record to the newly created record
final = pd.merge(new_df, df_appl_1[['title', 'Runtime']], on='title', how='left')
final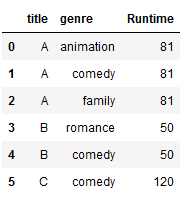
Here we go !
Information from columns
Just as often it can happen that the structure of the data (e.g. when joining datasets) does not fit. Have a look at this case:
df_appl_2 = pd.DataFrame({'Year': [2019, 2019, 2020, 2020],
                          'Season': ['Summer', 'Winter','Summer','Winter'],
                          'Rainfall_mm': [185, 2500, 320, 1800],
                          'Sunshine_h': [800, 500, 900, 600]})

df_appl_2 = df_appl_2.groupby(['Year', 'Season']).sum()
df_appl_2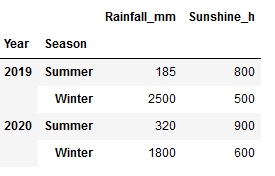
In such a case the stack function can also be used:
final2 = df_appl_2.stack().reset_index()
final2.columns = ['Year', 'Season',
                  'Weather_Information',
                  'Value']
final2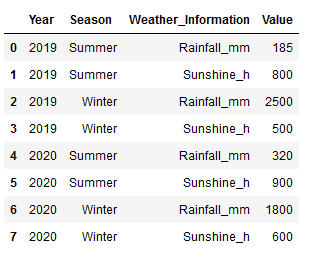
4.2 melt()
Pandas melt() function is used for unpivoting a DataFrame from wide to long format.
Melt in pandas reshape dataframe from wide format to long format. It uses the id_vars[‘Column_Name’] for melt the dataframe by column names.
I will always show the original dataset so that you can better understand the melt commands.
print('Original DataFrame:')
df
df_melt = df.melt()
df_melt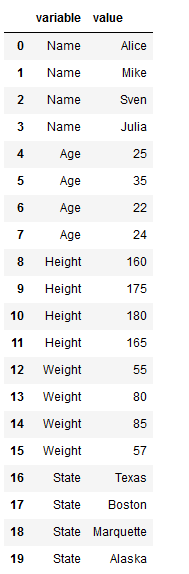
print('Original DataFrame:')
df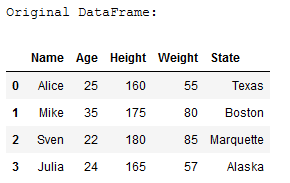
df_melt2 = df.melt(id_vars=['Name'])
df_melt2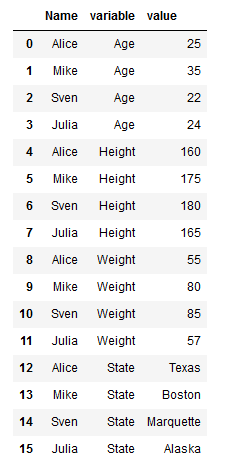
print('Original DataFrame:')
df
df_melt3 = df.melt(id_vars=['Name', 'State'])
df_melt3
Use the id_vars[‘col_names’] for melt the dataframe by column names and id_value_vars[‘col_names’] as the value variable.
print('Original DataFrame:')
df
df_melt4 = df.melt(id_vars=['Name'], value_vars=['Age'])
df_melt4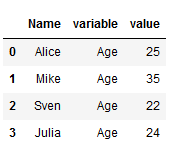
With var_name and value_name you also have the possibility to name the two generated columns accordingly:
df_melt4 = df.melt(id_vars=['Name'], value_vars=['Age'],
                  var_name ='Variable_column', value_name ='Value_column')
df_melt4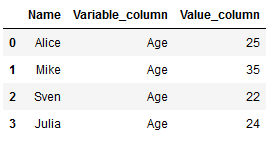
4.2.1 Application example
Here again an example how melt can be used in practice. We have the following data set:
df_appl_3 = pd.DataFrame({'Age': [24,22,26],
                          'Work_Experience': [7, 5, 8]})
df_appl_3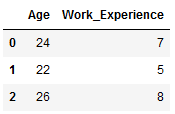
Our goal is to create a boxplot with seaborn.
data_melt = pd.melt(df_appl_3)
data_melt
sns.boxplot(x="variable", y="value", data=data_melt)
plt.title("Boxplot",fontweight='bold')
plt.xlabel("Columns",fontweight='bold')
plt.ylabel("Years",fontweight='bold')

plt.show()
The two commands shown before do not have to be executed separately. It is also possible to write them together:
sns.boxplot(x="variable", y="value", data=pd.melt(df_appl_3))
plt.title("Boxplot2",fontweight='bold')
plt.xlabel("Columns",fontweight='bold')
plt.ylabel("Years",fontweight='bold')

plt.show()
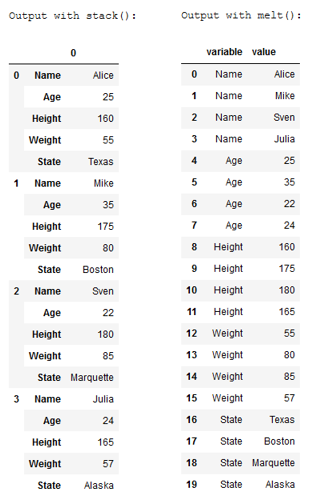
5 Comparison of stack() and melt()
To better understand the different functionality of the two functions stack() and melt() I have compared the two outputs again:
print('Original DataFrame:')
df
Comparison of stack() and melt():
6 Conclusion
In this post I have shown how to use the stack() and melt() functions to reshape panda’s DataFrame accordingly.